Solutions

Two products. Deploy either.
Run both and they compound.

Thalamus SRE puts a governed fleet of AI agents on your incidents. ThalamusTrace is the OTLP-native observability and AIOps platform underneath. Each stands on its own — and each is genuinely useful without the other. Together, the signal that raises a problem and the fleet that investigates it are the same system, so nothing is lost translating between them.

Start either product on a low-cost Staging instance. Add the second whenever it earns its place.

Thalamus SRE

Agentic SRE & resiliency

A fleet of specialist agents placed between your signals, your source code and your system of record — so an incident goes from alert to a reviewed root cause and a merged fix without a human stitching three tools together at 3am.
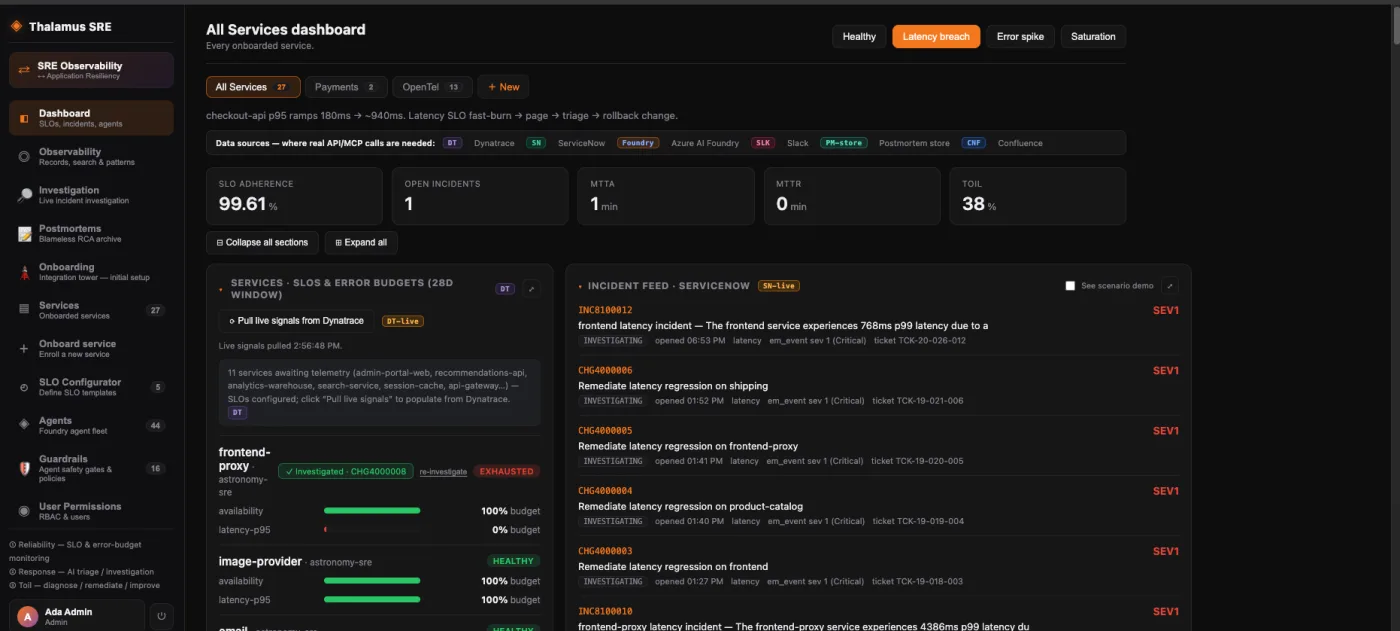
Thalamus SRE — the All Services dashboard, showing SLO adherence, open incidents and a live ServiceNow incident feed
The console: SLO adherence and error budgets on the left, the incident feed on the right, and the agent fleet a click away.

The incident lifecycle, run by agents

An SLO breach opens an incident. Triage classifies it, golden-signal specialists investigate in parallel, and an investigator synthesises one verdict from their findings — then a second model tries to refute it before anything is acted on.

Reasoning you can audit

Every step of the agent-to-agent chain is recorded: what each specialist probed, what it concluded, and which guardrails applied. You read the reasoning, not just the answer.

Application resiliency

Audit repositories for resiliency gaps, scan for vulnerabilities, tune configuration from live traffic, and raise the fix as a pull request — with the learnings kept in a knowledge base.

Postmortems from the record

Drafted from the recorded activity log rather than from memory — timeline, root cause and action items assembled from what actually happened, then published where your team reads them.

Deployed on its own

Thalamus SRE reads whichever observability platform you already run — Dynatrace or ThalamusTrace — alongside GitHub for code and ServiceNow, Jira or Azure DevOps as the system of record. If you have an incumbent APM and no intention of replacing it, this is the product you want, and it changes nothing about your monitoring.

It runs in your own instance, in the region you choose. Reasoning can run on a local model fleet or a cloud provider; a PII redaction gateway sits between your signals and the models, enforced server-side so raw data never leaves your boundary.
ThalamusTrace

Observability & AIOps

Metrics, traces, logs, infrastructure and AI observability behind a single navigation — so "what broke, why, who's affected, and what to do next" is one investigation rather than four tools and a guess.

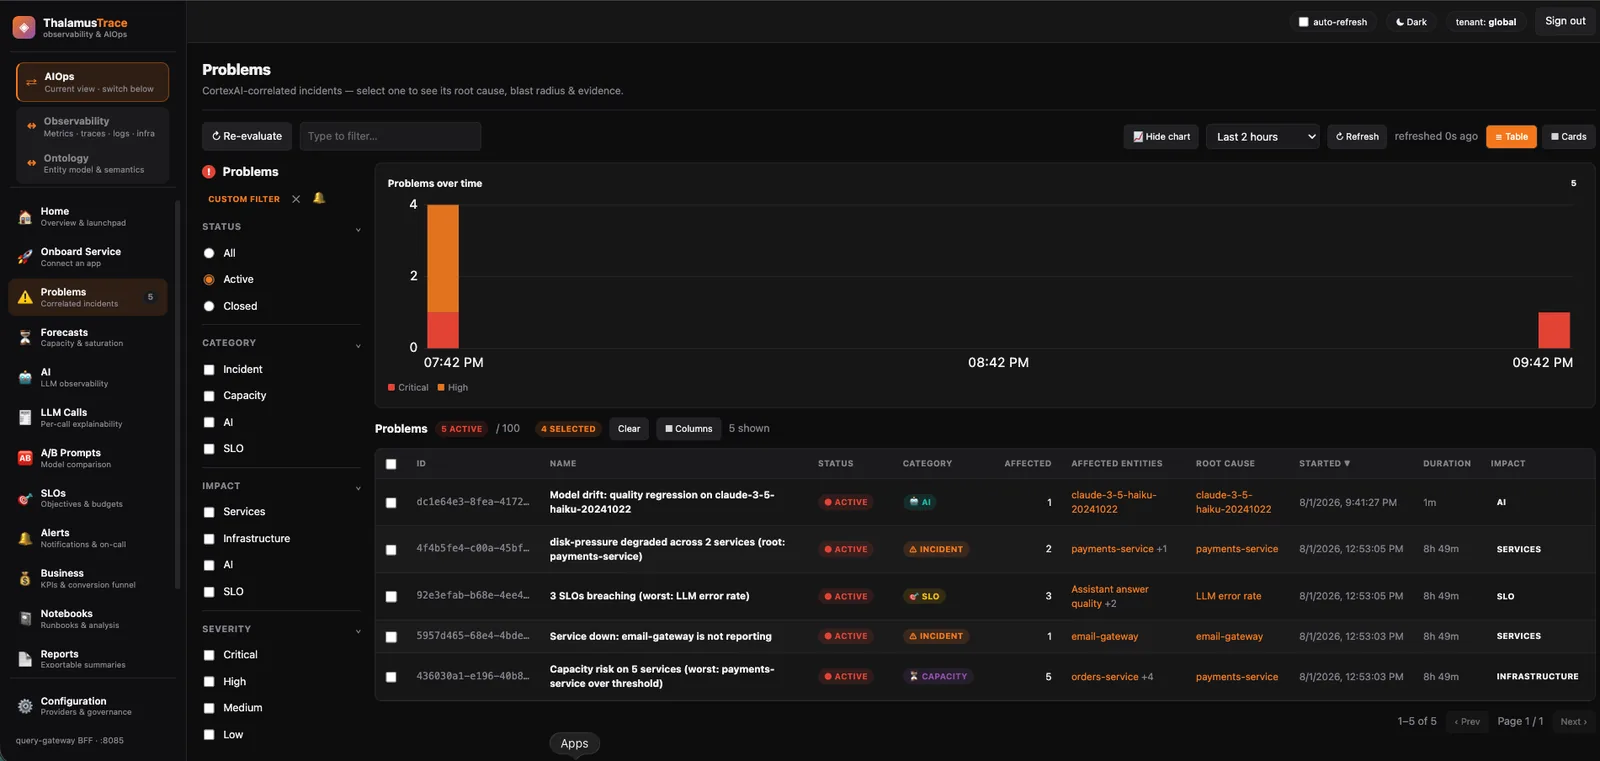
ThalamusTrace — the Problems view, showing CortexAI-correlated incidents with root cause, affected entities and impact
Correlated Problems, each with a root cause, the entities affected and the evidence behind the call — not a list of alerts.

Problems, not alert storms

Concurrent anomalies across services are correlated into a single Problem with a causal root cause, a blast radius and the evidence behind the call — instead of five separate alerts arriving at once.

SLOs with budgets that burn

Objectives on latency, error rate, quality and cost, with live budget burn and breach alerting before the objective is actually missed. The difference between a dashboard and an operating discipline.

A topology that draws itself

Every request across the estate, and a service map built from the traces rather than from a diagram somebody maintained by hand.

LLM observability, first class

Cost, tokens, latency and quality per model, drift detection and LLM-as-judge scoring, plus a hash-chained audit of every call — the same treatment as any other dependency.

Deployed on its own

ThalamusTrace is OTLP-native. Point an existing exporter at it with OTEL_EXPORTER_OTLP_ENDPOINT — no proprietary agent, no re-instrumentation, and nothing to rip out. If your goal is to replace a per-host-priced APM without a migration project, this is the product that does it.

Capacity forecasting raises a Problem ahead of a saturation breach rather than after it, and problems can be delivered onward by signed webhook to whatever you already page with.

Run both

Where they compound

Most estates pay twice for the gap between monitoring and response: once for the platform that notices, again for the people who work out what it meant. Running both closes that gap in software — the correlated Problem is the trigger, and the agent fleet is what happens next.

ThalamusTrace

Correlates concurrent anomalies into one Problem with a causal root cause and a blast radius.

Handoff

Delivered to Thalamus SRE by signed webhook — verified, deduplicated and queued, not emailed to a rota.

Thalamus SRE

Specialists probe the same telemetry that raised it, correlate against the code, and synthesise a verdict a second model then tries to refute.

Your systems

A ticket in your ITSM, a pull request against the cause, and a postmortem drafted from the recorded activity.

 Either product aloneBoth together
Investigation input Agents read whichever platform you run; an alert carries what that platform chose to send. Specialists query the raw estate directly — traces, logs, topology and failures, not a summary of them.
Time to first evidence A human opens the monitoring tool, then opens the console, then correlates the two. The Problem arrives already carrying the entities, and investigation starts unattended.
Coverage of the estate Scoped to what your incumbent platform instruments and licenses. OTLP-native ingest means services are covered because they emit, not because they were licensed.
Commercials One Thalamus subscription alongside your existing APM bill. One vendor, one boundary, one estate — and the APM line item is the one that goes away.
Data boundary Telemetry crosses whatever boundary your incumbent platform imposes. Both run in your instance, in your region, with redaction enforced before any model call.

Adopt them in either order

Neither product assumes the other. Teams with an incumbent APM usually start with Thalamus SRE and keep their monitoring exactly as it is. Teams replacing a per-host-priced platform usually start with ThalamusTrace and add the fleet once the telemetry is flowing.

Switching an existing Thalamus SRE instance from one signal source to the other is a configuration change, not a migration — and it can be set per service, so a single estate can move across at whatever pace suits it.

Both products provision the same way: pick a region and a name, and you get a URL in minutes rather than a quarter of procurement.