This is the real product,
running on real telemetry.
Not a mockup and not a video — the same observability and AIOps console our customers run, loaded with metrics, traces, logs and correlated problems from a live microservice estate. Explore anything you like; nothing you do here changes it.
Guided walkthroughs
Start here
What you'll see
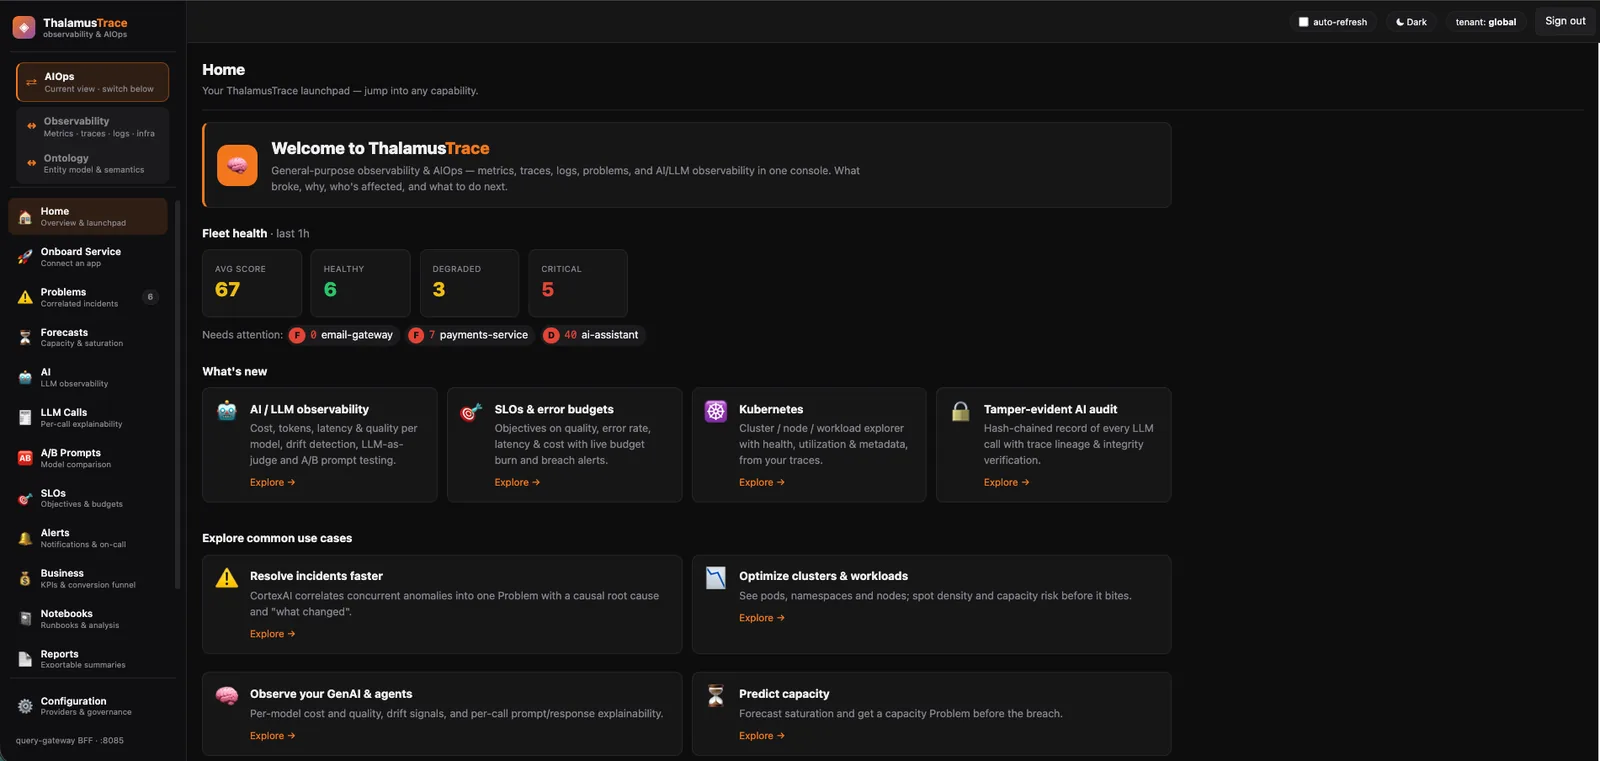
Metrics, traces, logs, infrastructure and AI observability behind a single navigation — so “what broke, why, who's affected, and what to do next” is one investigation, not four tools.
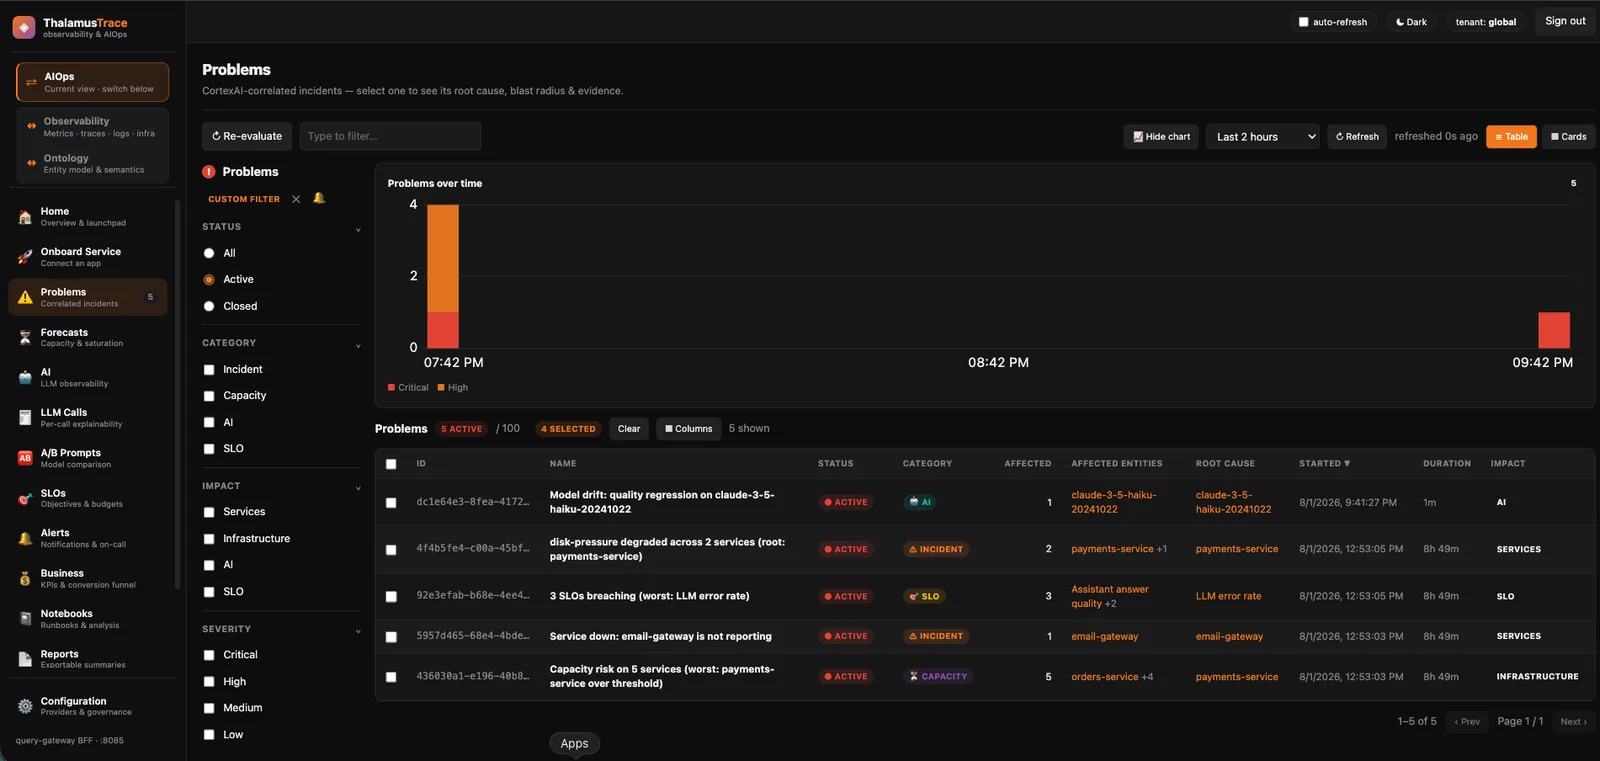
Problems, correlated and explained
One Problem per incident, with the root cause and blast radius on the row before you open anything.
- Incident, capacity, AI and SLO problems in one queue
- Filter by status, category, impact and severity
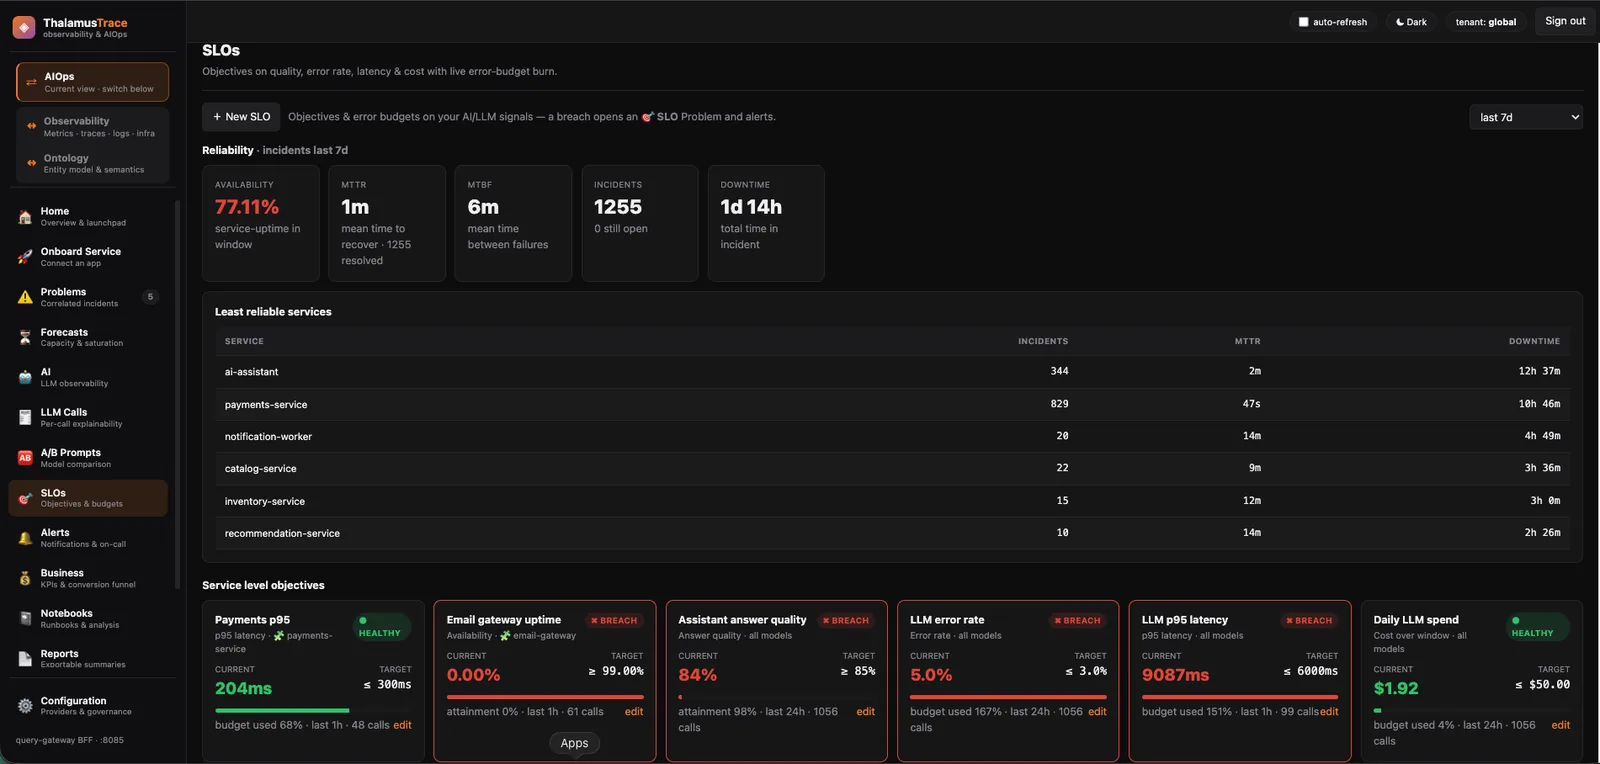
Objectives and error budgets
Burn-rate alerting before the objective is missed, per service and per model.
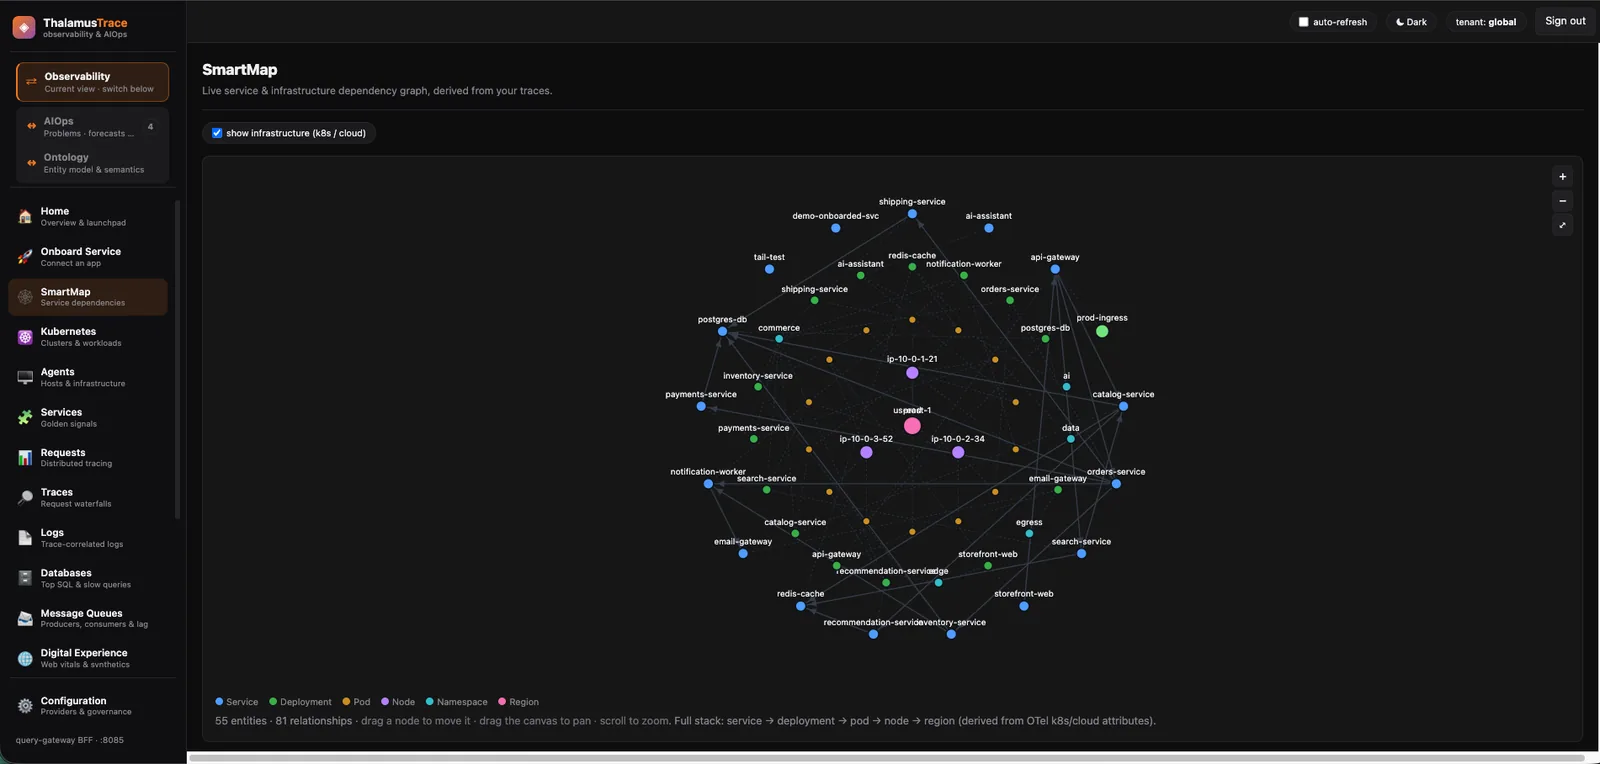
A topology built from traces
Dependencies discovered from real requests, not declared in a diagram.
AI and LLM observability
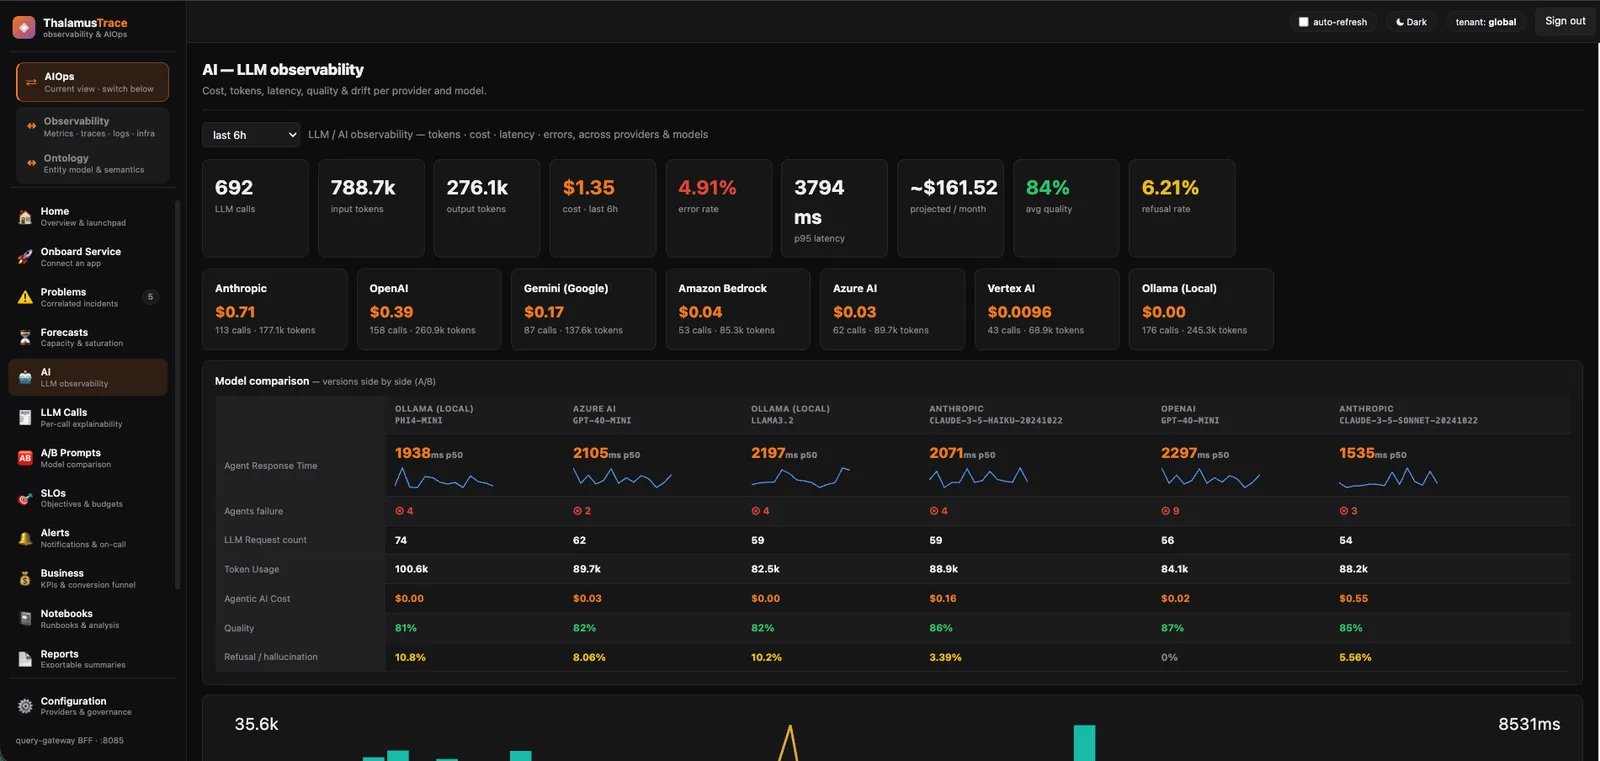
Cost, tokens, latency and quality per model, with per-call prompt and response explainability.
Capacity, before it bites
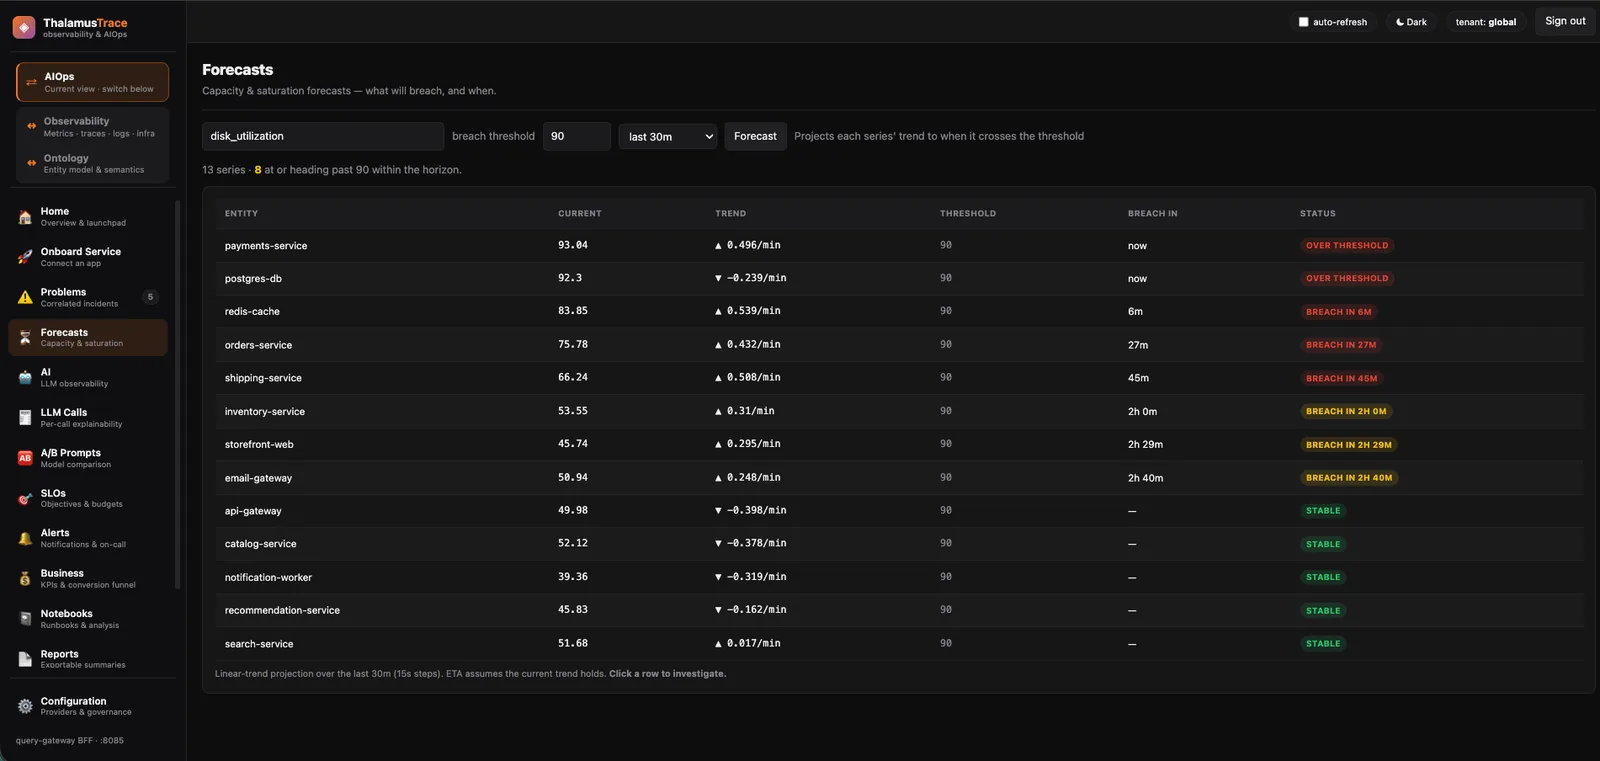
Forecasts that raise a Problem ahead of a saturation breach rather than after it.
Ground rules
Editing, saving and remediation are refused so the environment stays coherent for the next visitor. Blocked controls say so rather than disappearing.
Sessions last 24 hours and need no signup or card. Leave the tab open and come back to it.
An instrumented estate emitting genuine metrics, traces and logs, with failures injected on purpose — so the problems are ones the platform detected.
ThalamusTrace is OTLP-native — point an existing exporter at it with OTEL_EXPORTER_OTLP_ENDPOINT. No proprietary agent, no re-instrumentation.